[Log] Performance testing with JMeter
14 Feb 2013I've always been curious about our web service performance. My first attempts to measure the server capacity was to generate a system load manually:
1. Generate disk IO operations - Copy large files from place to place. E.g Create a 10GB file
[sourcecode]dd if=/dev/zero of=10g.img bs=1000 count=0 seek=$[1000*1000*10][/sourcecode]
2. Generate netword load - Download or upload large files
3. Generate both CPU utilization and disk IO
[sourcecode]dd if=/dev/zero of=/dev/null[/sourcecode]
[sourcecode]fulload() { dd if=/dev/zero of=/dev/null | dd if=/dev/zero of=/dev/null | dd if=/dev/zero of=/dev/null | dd if=/dev/zero of=/dev/null & }; fulload; read; killall dd[/sourcecode]
And monitor the load when running the above scripts. This method can help analyzing the alarm threshold where the system should page someone once the threshold is met. However unless sophisticated scripts are written, running those repeatably can be tiring. This is where JMeter comes to rescue.
Next step is to actually test the app with JMeter. Since the web app is composed of mostly JSON APIs. I created a test plan hitting several APIs with GET/POST requests
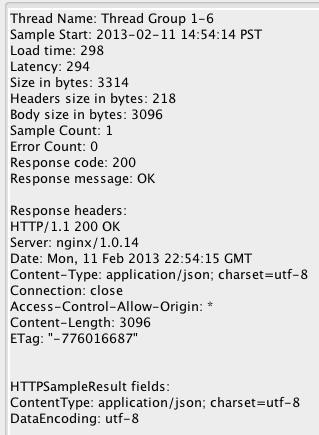
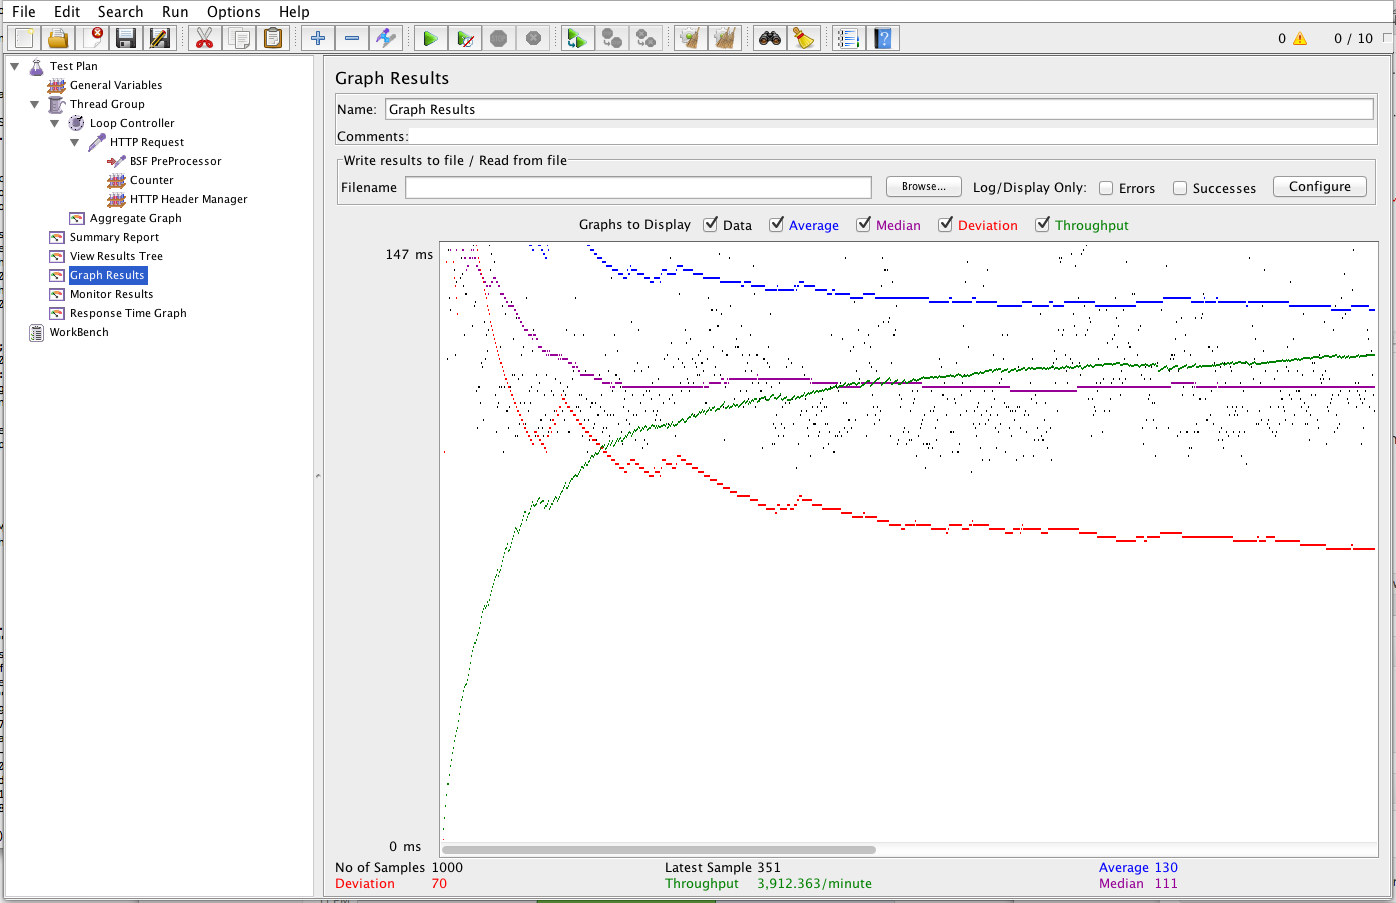
Below are sample results of 10 threads and 1000 loop count hitting an API
Interpreting the results
In Graph results, Data legend showed us a scattered points of response time while Median value showed us approximately steady response time over time. I assume I can use mean or median response time to estimate how fast the server responds to concurrent requests.
In combination of server resources monitoring, we can measure the point where bottlenecks appears by simply increasing the number of threads in intervals 100, 150, 200, 500... For example, at a point when there is a socket handup, if there is enough memory, we can increase accordingly the number of node in the app cluster.

